
The Monitoring tab is the Machine Monitoring System (MMS) module of PiQ. Use this module to track the uptime / downtime of your workstations.
Subtabs: Status, Reporting, History
Status
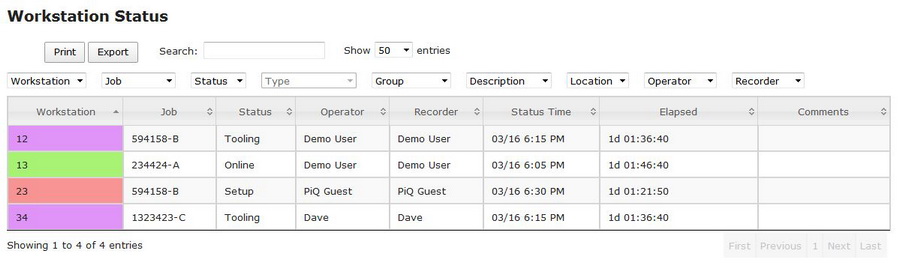
The Status tab is your shop floor interface to workstation status. When an operator changes the status of a machine, they update the system on this page.
Table
There is one row for each workstation in your facility. The list is updated whenever you add or remove machines in your Admin > Setup tab.
Please see the Interacting with Tables section of this manual to learn how tables work. In this page, we will deal with the specific data in this table.
In the example, we see that Workstation 13 is online and producing parts, while 12 and 34 are currently down for tooling. #23 is in setup.
The status codes and the colors you designate for them are established in your Admin > Setup tab of PiQ. Review the guide if you have not yet established your codes.
To change the status of a workstation, click on the colored cell with the workstation identifier. The form will appear:
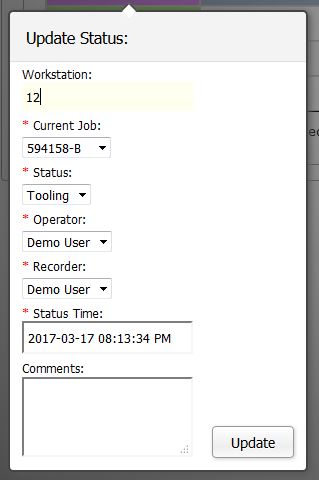
- Current Job: The part number in production (or in setup status) at this workstation.
- Status: Select a new status to update the system.
- Operator: Select the operator currently working at this workstation.
- Recorder: If someone other than the operator is updating this status, select their name here.
- Status Time: This is the time the status change will be reported. If you should forget to change a status the moment you make a change on the shop floor, you may change the time here. Note that you cannot enter a time that is later than the present time.
- Comments: Enter any comments you would like to attach to this status change.
Once you have completed entering the details for the status change, click Update and your table will reflect the current status and color code.
Reporting
The Reporting tab is a high-level view of the status for each workstation over the two production days. We’ll review one machine to familiarize you with the information.
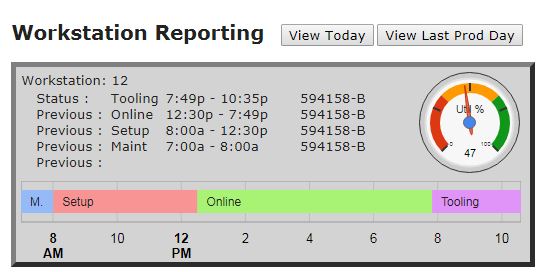
Reviewing Workstation #12 reveals:
- Status: The current status is Tooling. We are viewing this at 10:35 PM, and the machine has been in tooling status since 7:49 PM.
- Previous Status: Each of the previous statuses, and their duration, is listed below the current status. Prior to going down for tooling, the machine was in production from 12:30 PM to 7:49 PM.
- The time graph at the bottom represents each status across time, with the colors you assigned to each status in setup.
- The Utilization dial graph on the right side shows that the machine has been utilized 47% of the time period represented.
- At the top of the graph, you can toggle between today’s production and the previous day.
History
The History table captures the entire history of workstation statuses.
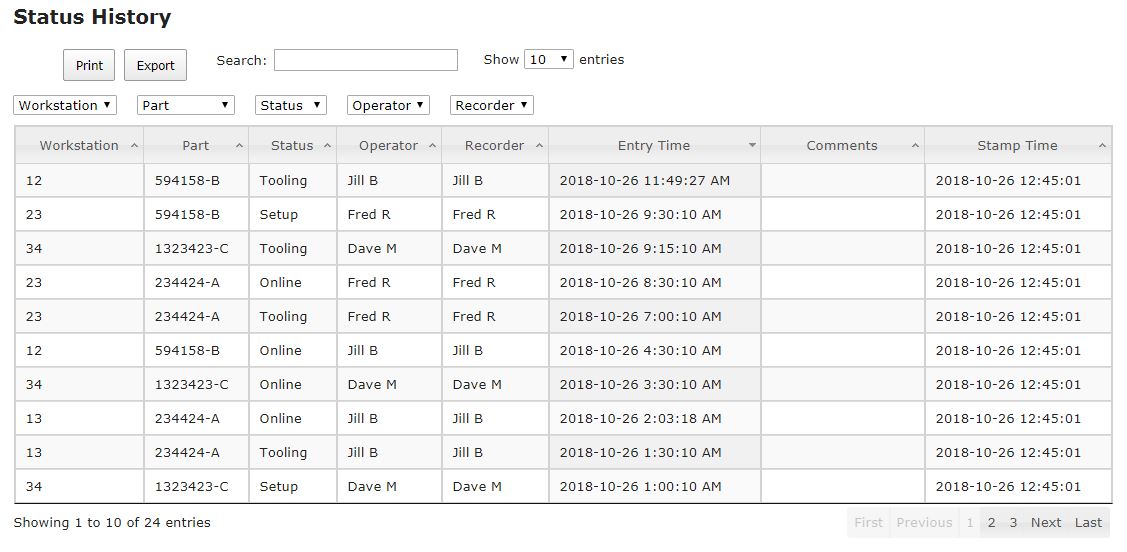
With the column filtering and sorting options, you can view history for any machine, or any part, or whatever information you wish to display.
This data is exportable to a comma delimited file, which can be imported into any analysis tool you choose, such as Excel.
Simply apply the filters you want to get the data set you need, then click the Export button to save that subset of the data as a .CSV file.
