
Most of your interaction with the data in PiQ is table-based. Let’s review the general features of a table so you’re familiar with them.
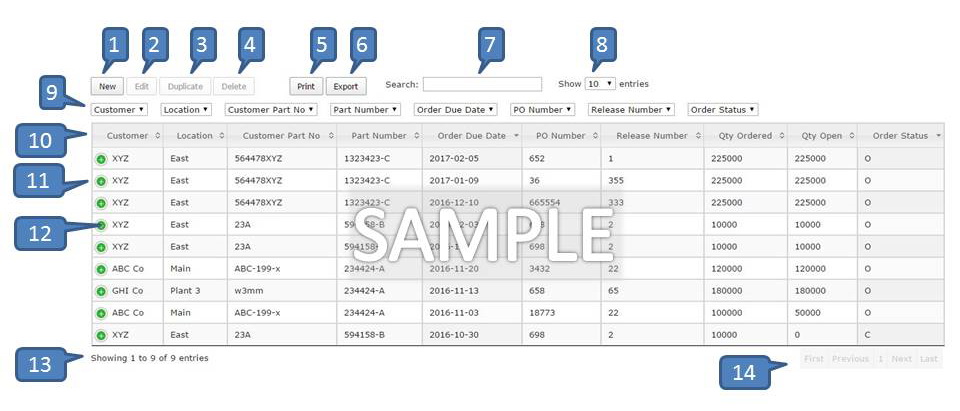
- New button: Click to create a new record in the table.
- Edit button: Select a row in the table and this button will become active. Click the button to edit the row you selected.
- Note that multi-select is available for editing. You may use your Shift key and mouse to select a set of rows, or your Ctrl key and mouse to select multiple rows that are not in series.
- Duplicate button: Some tables utilize a duplicate button to speed entry of multiple similar rows. If this button is available, select the row you wish to duplicate and then click the button. A new entry form will appear pre-populated, and you simply need to change any data that is different for the new entry.
- Delete button: Select a row in the table and this button will become active. Click the button to delete this row from your table.
- Print button: Click this button and a new window will open with your data, ready to use your browser’s print command. Any filters you apply to the data set will apply in your print results.
- Export button: Click this button to export your data in a .csv (comma-delimited) format. CSV files can be opened directly in Excel, or many other spreadsheets and applications. Any filters you apply to the data set will apply to your exported data.
- Search box: This is a dynamic search box that filters the entire table across all columns based on your input.
- Table Length Selector: Use this select box to change the number of rows per page in your table.
- Filters: Each of these select boxes allows you to filter the table based on the criteria you have selected. You can select multiple values from a single column, and / or multiple values from multiple columns. Filters can be removed individually by clicking on the values.
- Column headers: Clicking on a header sorts the table on that column. Clicking it more than once alternates between ascending and descending order. You may also sort on multiple columns by clicking on the first column for primary sort, then holding your shift key while selecting a column for secondary sort.
- Rows: Each row represents a record in your data.
- Row Expansion Indicators: If the screen size is below a certain threshold, the table may display a limited number of columns. Click on the (+) button to display the rest of the information for each row.
- Entries count: Shows how many total records are in the data set, and how many you are viewing presently.
- Page navigation: Use these buttons to navigate forward and backward through the data set.
Note that you may not see all of the same buttons or features in each individual table. See the instructions for each content area for further instructions.
