
The Dashboard is the Operating System View of your company. From this single page, you get a comprehensive view of your status for each item in production. Let’s look at each area of the Dashboard individually:
Header
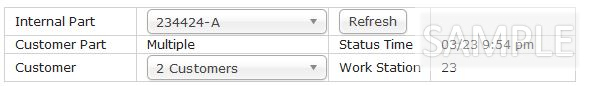
- Internal Part: This is your internal part number for the item you wish to view. The select box is populated with all of the parts that currently have open (unfilled) orders. You may also enter the first few characters of the part number to filter the list.
- Customer Part: This is the number that your customer assigns to this part. If you have multiple customers for a single part that you produce, it will display “Multiple.”
- Customer: This is the customer name and location. If there are multiple customers for a single part, it will display “Multiple.” In the case of multiple customers, a dropdown list will populate allowing you to view the orders for each individual customer. You may also enter the first few characters of the customer name to filter the list.
- NOTE: When drilling down to a single-customer view for a part with multiple customers, only Orders and Shipments for that customer will be displayed on the graph, and the speedometer graphs are disabled. This is because this information is only relevant when viewed in the context of “All Customers.”
- Refresh button: Clicking this button will refresh the page data for the part displayed. If anything has changed in the part status since your last view, this will update the page.
- Status Date: The date and time the information was displayed.
- Work Station: The workstation identifier(s) where the part is currently being produced.
Alert Panel

The alert panel displays any message that you need to communicate to anyone viewing this part status. It appears just below the header table, and only when an alert exists for the selected part. Use alerts to communicate urgent information to your team.
Main Graph

This is your overall view of status for this part. Let’s take a look at each graph individually.
- Orders: Each date / requirement you have for this part is stacked here. In this example, we have a partially filled date on 3/28, and two more order dates queued up behind it. Note: If there is a single customer for this part, each date represents one order. If there are multiple customers for the part, each date represents to total required to fill that date.
- Shipments: This graph displays your shipments against outstanding orders. In this example, we have a partial shipment of 50,000 shipped against the 3/28 order. The shaded box above the shipment shows how many are still due to be shipped when you mouse-over it in the live environment.
- Production: This graph shows the production against your orders. The darker orange portion represents production that has already shipped. The lighter area shows that we have 53,277 parts on hand (enough to fill the remainder of the order.)
- Material: Shows how much material you have remaining that has been allocated to the production of this part. The darker area is material already used, the lighter area shows how much you have remaining. If you mouse-over the lighter area in the live environment, it will tell you the number of parts you can still produce with your allocated material.
In one glance at this graph, we quickly learn:
- Our next open order has 50,000 parts remaining to be shipped.
- The parts are on-hand and ready to go.
- We need to allocate more material to continue producing against the next order.
Speedometer Graphs
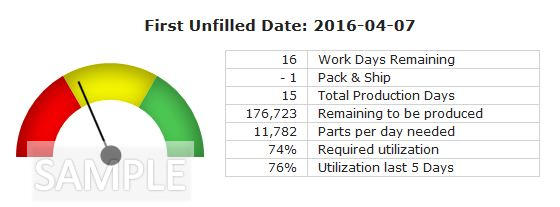
This is the first of two speedometer graphs that will tell us how we’re doing against the next open orders. Note that the first date represented is 4/7, because the 3/28 order date is completed.
- Work Days Remaining: This tells us how many working days remain between today and the order due date. This takes into account the actual days your facility is open to produce. (If, for example, your company does not produce on weekends, this number represents the count of Monday thru Friday days. It will also exclude any holidays you have designated.
- Minus leadtime days (currently showing “Pack & Ship”.) When you set up a part in your Part Master, you can add “buffer” days that must be factored in to the days you have remaining to produce. In this case, we have established that we need production completed a day before the order is due, to give us time to pack it and ship it out the door. If you have secondary operations that must be performed on the part (i.e. outsourced heat treating, plating, etc) that take a week to complete, you’d set them up with a -5 value (five business days) to assure that your production is completed in time.
- Total Production Days: The actual number of days you have to produce the part to complete the order (Work Days – Leadtime Days.)
- Remaining to be Produced: The number of parts you still need to produce to make the order. In the example, there are 3,237 more produced than are required for the 3/28 order. That leaves 176,723 left to complete the 4/7 order.
- Parts per day needed: The number remaining to be produced divided by the total production days. In the example: 176,723/15 = 11,782.
- Required Utilization: Based on the parts per hour rate that you establish in part setup, this figure represents the required utilization of your workstation to meet the order.
- Utilization Last 5 Days: This figure looks at your recent production (up to 5 days) and reports the level of machine utilization over that period. This allows us to compare your recent rate against your required rate to plot the speedometer graph.
- Speedometer Graph: This tells you the likelihood that you will make the order date on time, given your recent performance. In the example, you can see that we need 76% utilization of our machine(s) to make the order, and we’ve been running at the rate of 76% the last five days. Therefore, the needle is just inside the red, indicating that we’ll make the order if we continue at this rate, but we’re close to falling behind if anything goes wrong!
The second speedometer graph looks forward to the second open date.
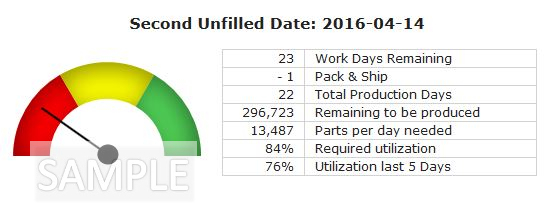
The second speedometer graph has the same table rows as the first, so we won’t go through them individually. However, there are a few key things to note about this graph:
- The production days remaining are from now until the due date.
- The total remaining to be produced includes all that we still need to produce for the first open date, and all that are required fo the second open date.
- While the first speedometer graph showed a quantity of 11,782 parts per day needed, we actually need to be producing 13,487 parts per day as of now to make both orders. If we continued producing at the rate in the first graph, we’d make the order…but then we’d be behind the eight ball on the next order with only a week left to produce.
In one glance at the speedometer graphs, we quickly learn:
- We’re doing “OK” at meeting production for the 4/7 date, but it’s not good enough! If we look forward in time, we see that we actually need an 84% utilization rate (as of now) to make the second order. This tells everyone on the shop floor that this part needs to be in their focus to assure meeting customer requirements.
Production 30 Days
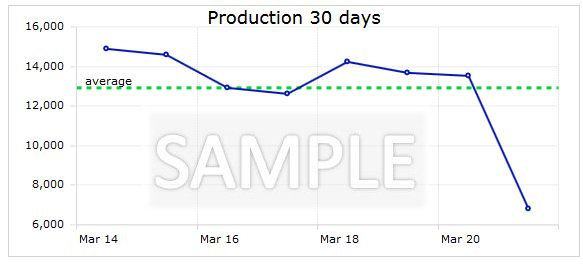
This is our overall view of recent production by date. If you mouse-over this graph in the live environment, you can see the actual number for each date. In one glance, we see that:
- We’ve been averaging about 13,000 parts per day in production.
- Something may have went wrong on March 21, where we produced about 1/2 of our average.
Additional Info Panel
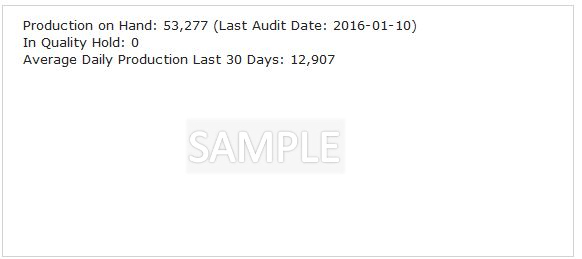
This panel communicates additional information about the part, including:
- The number of parts on hand, including the last date that count was audited. This gives you some idea of the accuracy of the count.
- An alert if there is unaccounted production, i.e. you have shipped more than you show as “on hand.”
- The number of parts on quality hold, if any.
- Your average daily production
- Other information to be added soon!
